4 Estimation 101
Forecasting, like any other quantitative activity, involves putting numbers down at some point. Often, getting the exact numbers isn’t too important, but it’s important to get a number “decent” enough to get a good grasp of the situation. This is the skill of estimation.
For example, suppose we are forecasting something involving the population density of the US, either soon or in 100 years.
- To get the population density, by definition we need the number of people divided by the geographical area. This means we need both of these numbers. Let’s start with the geographical area.
- To get the geographical area, one way to get there is having the (inexact, because it’s an estimation) model that the US is basically a rectangle. This means we can estimate its area by having numbers for its width and height.
- To get the width of the US…
This train of thought leads nicely to our first warmup:
4.1 A Warmup
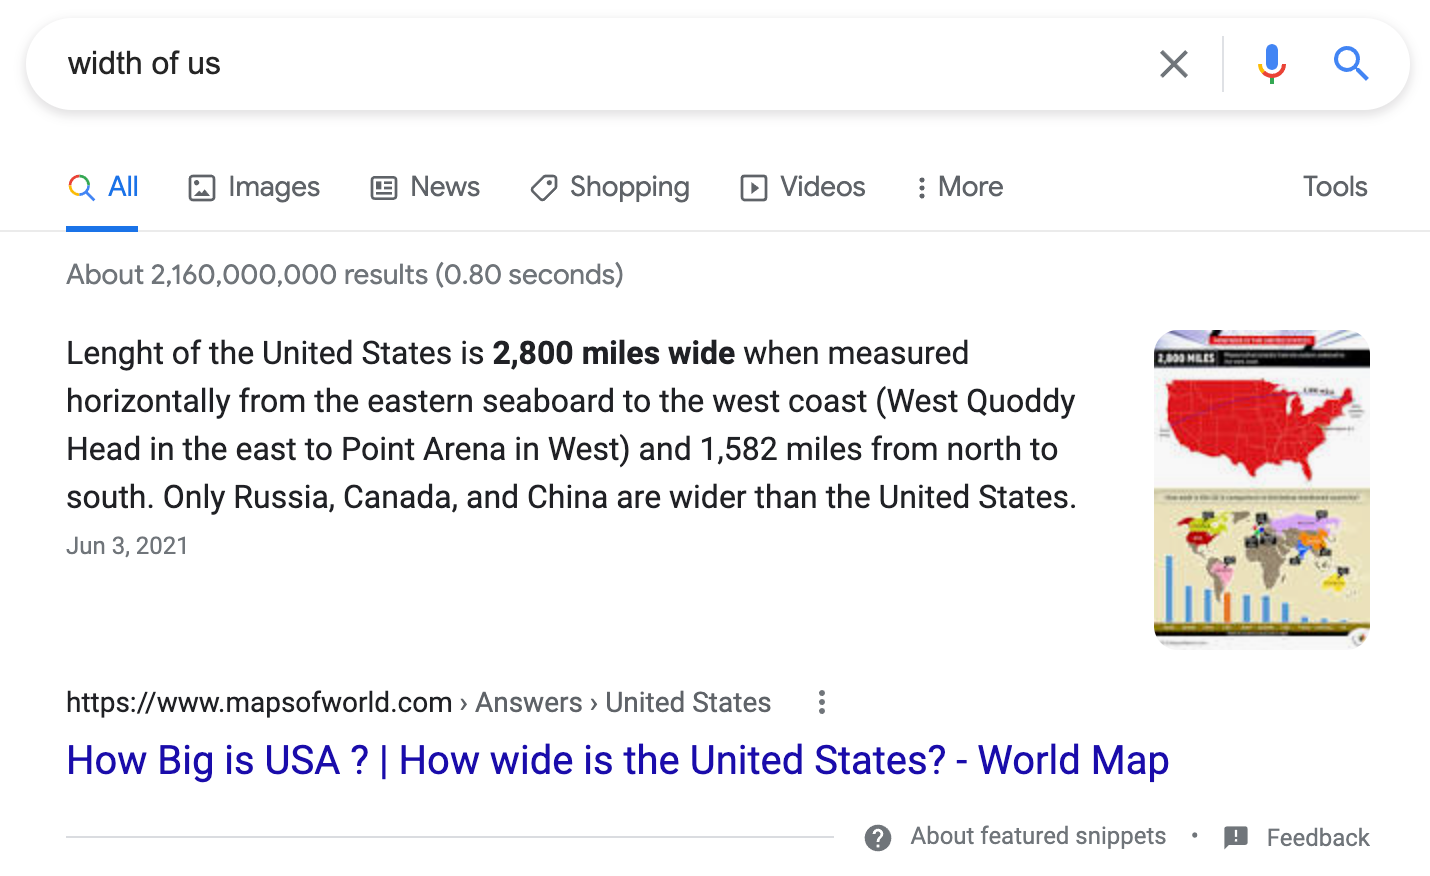
What is the width of the US? Some of you might just already have this number in your head. If you didn’t know it, however, we have to put down some number. As you might guess from the title of the class, we are about to teach you the best way to put a number down that you don’t know. This is, of course, to Google the number. A quick google gives that it is about 2800 miles.

Okay, so that’s not actually the point of this class, which is to teach you how to estimate things in your head instead of asking Google. For me, the two best reasons for doing this are:
To be able to figure out things that are hard to look up. Many things have actual numbers but nobody bothers to have an exact count (e.g. how many people in the U.S. are on the Keto diet right now), especially if it comes from your personal life (e.g. how many hours you spend a day on daydreaming). It’s also important to bear in mind that many “official” sounding numbers (width of the US, say) are themselves obtained from estimation.
To “stay in shape” with quantitative skills. Estimation is kind of like arithmetic, weight training, or being able to fix things yourself. We can use calculators to do calculations faster, use trolleys to carry things, or send things into a tech repair store, but there is obviously a lot of value in learning to at least do some things “by hand.”
4.2 A Second Warmup
How many people live in Iceland? Here are a few things you might try. Note that what you would try in practice depends on what you already know!
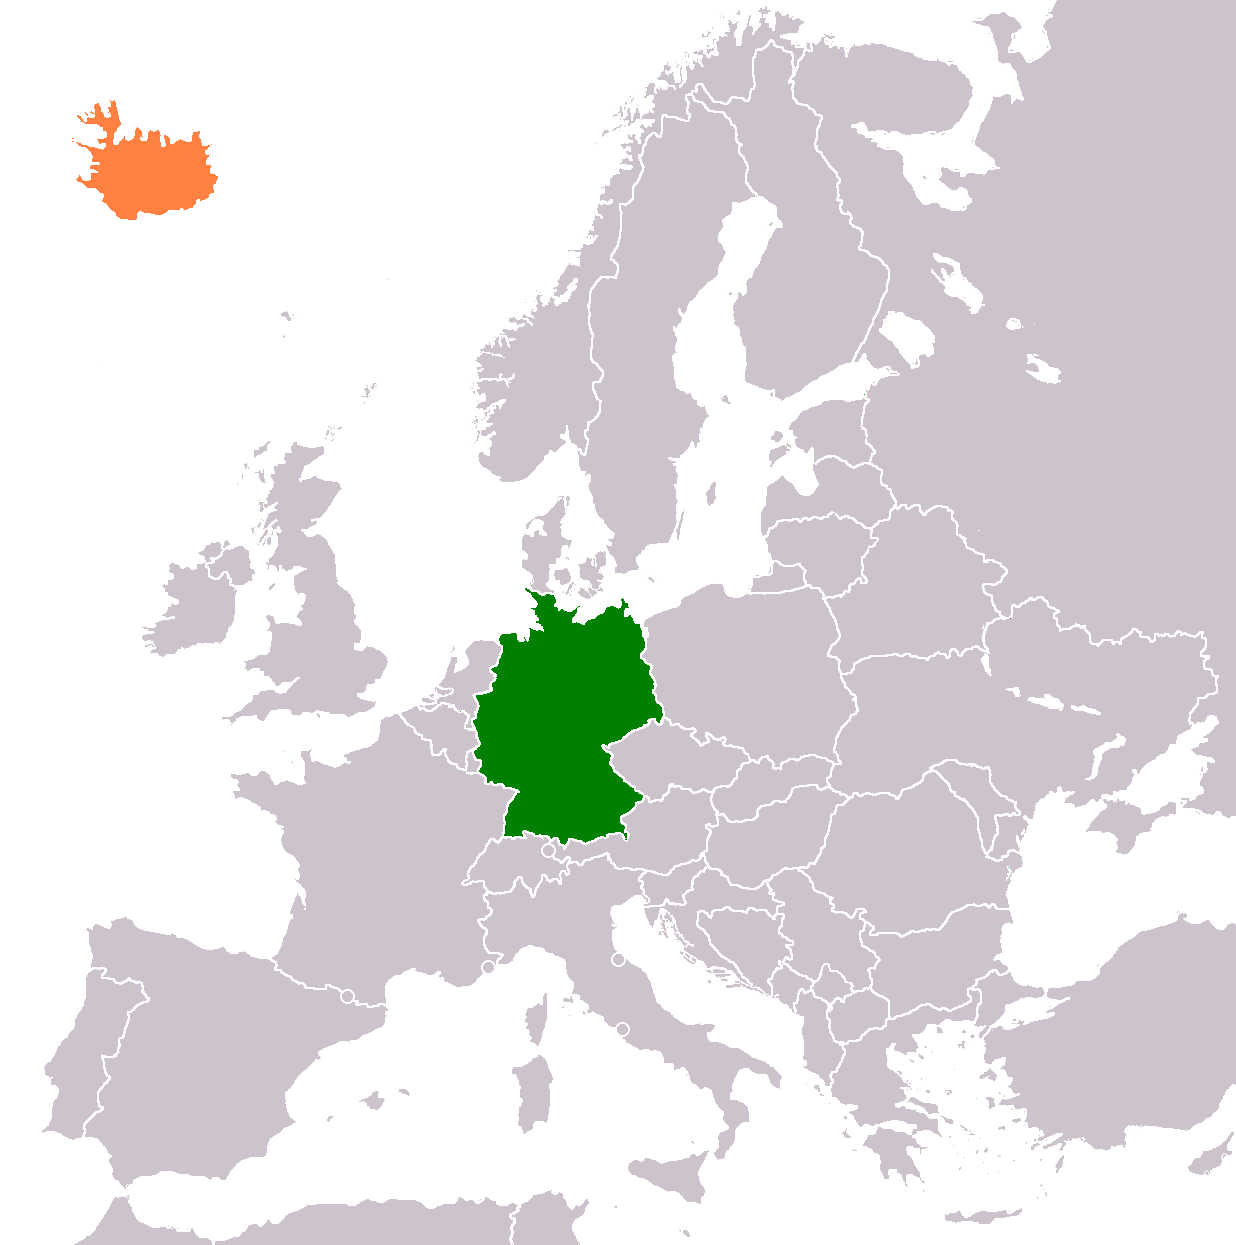
You know Iceland is a “small European country.” You know it’s smaller than Germany, and you happen to know that Germany has about 100 million people (around 80 million, to be a bit more precise). Since the answer is smaller, you divide by 10 and get 10 million.
Iceland “feels like Alaska” in terms of population density, amount of ice, etc. so they are probably comparable, though Alaska is bigger. You happen to know that Alaska has about 600,000 people, so you guess Iceland, which is smaller geographically, would have 60,000 people.
You happen to know that its capital, Reykjavik, has about 100,000 people. You also know that Iceland has very few “big cities” so the capital is probably a significant part of its population. So you make a guess and multiply it by 2 and get 200,000 people.
You happen to know the answer, because you are into geography. It’s around 300,000 people.

Map highlighting Iceland and Germany
We can already learn quite a few things from this example:
Much of the skill of estimation is cleverly using what you already know. If you know a lot of things, then it becomes easier to estimate more things. But even if you don’t know a lot of things, you can create a solution that works for you personally by using things you know. Much of the enjoyment of doing estimation is finding clever solutions that personally work for yourself.
We see the typical “building block” of estimation: typically, we set up simple algebraic relationships like X=AB, then “solve” for the unknown variable. For example, the second estimate is implicitly saying “the population of Alaska = the population of Iceland * the ratio of their areas” and then “solving” for the Iceland population by dividing the other two. This type of “divide and conquer” makes up for about 90% of the work of estimation.
As an example of how estimation “trains your knowledge,” suppose you did the first estimation and then realized you overestimated. This means you can now conclude (and verify!) “Germany was a bit bigger than I thought” and “Iceland is less dense than Germany.” Now you learned a bit more about the world. If you just looked up the number you would have failed to learn this.
4.3 Orders of Magnitude and Fermi
The numbers from our four approaches seem pretty different from each other, but I will now argue they are pretty good! How should we measure the goodness of our estimates? Well, supposing the “right” answer was 300,000 people and you got 400,000 people, then the absolute error (the difference) would be 100,000 people. This feels huge, but if you were estimating the population of the U.S. (300 million people) this amount of error suddenly starts to feel very small. This leads us to instead consider the relative error, the ratio between the estimate and the right answer, instead of the absolute error. In this case, the relative error would be about 1.33.
- A relative error of 2 would mean the right answer was X but you got X/2 or 2X.
- For bigger absolute errors, we typically use orders of magnitude of the relative error. This means we measure the relative error by powers of 10, so being “one order of magnitude off” from the true answer X means your answer is somewhere between X/10 to 10X, and “two orders of magnitude” would be between X/100 and 100X.
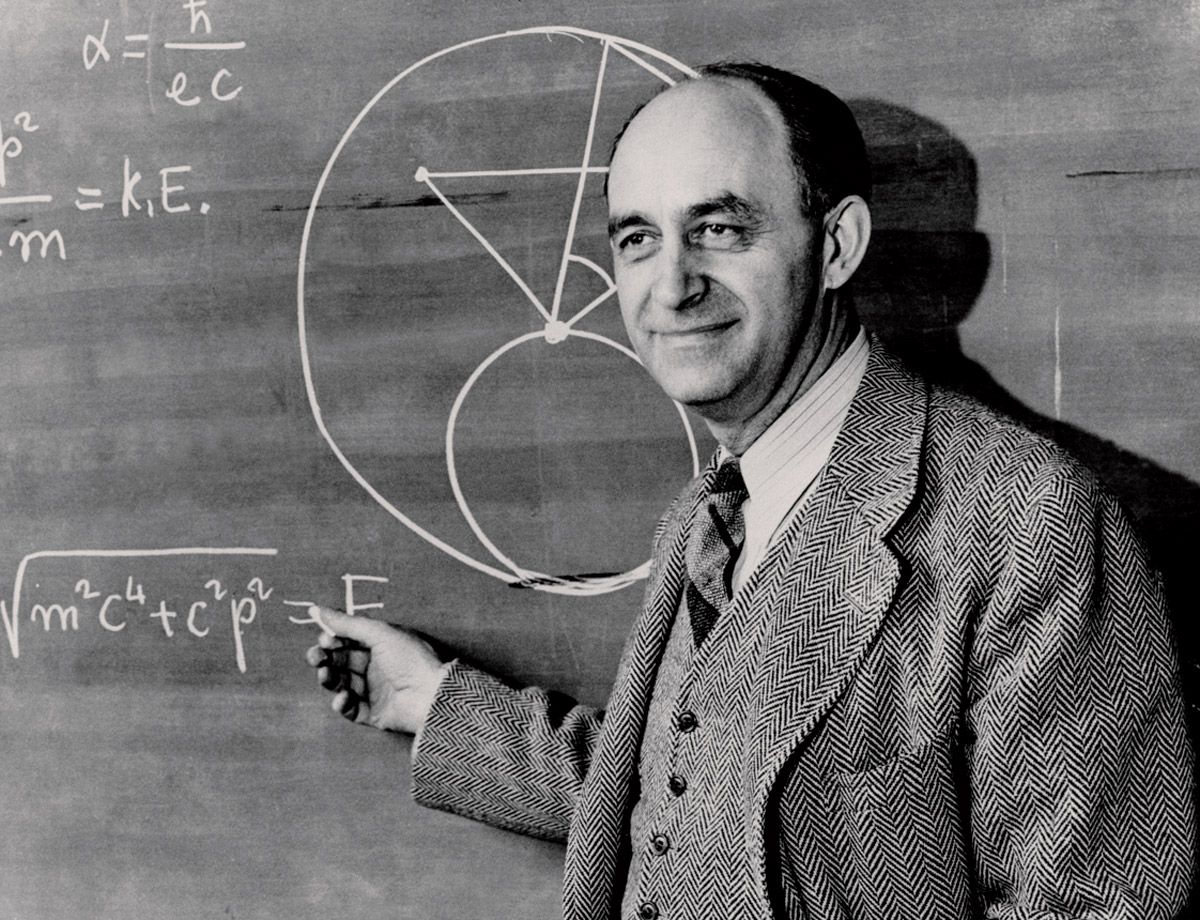
In this light, all of our estimations were within two orders of magnitude, despite using very non-sophisticated techniques! Estimations are popular among physicists and engineers because it allows them to exercise their mental models of the physical world. They typically do what’s called Fermi estimations, where they only care about the order of magnitude. The name “Fermi” refers to the famous event where the physicist Enrico Fermi estimated the strength of an atomic bomb explosion, obtaining an answer of 10 kilotons of TNT while the accepted answer is about 20.

Enrico Fermi at a chalkboard
The more you know, the better you will be at getting tighter and tighter relative error bounds. What’s “good”, however, is very context dependent:
In the Fermi example, a relative error of 2 is quite good, and I am guessing being off by an order of magnitude would have been bad for engineering purposes but fine for an estimation. Context matters!
If we are just practicing, then for very big or small numbers (for example, estimating the number of cells in the human body) I think most of us would find an error of within 2 orders of magnitude as “acceptable” and an error within 1 order as “good,” though biologists and/or doctors may want to be harder on themselves!
4.4 More Practice
What is the radius of the Earth? A few things:
Don’t look up anything since it makes this boring.
If you did already know this / looked it up before, you should try to do this some other way - you will still be able to learn something from the training.
If you finish very quickly, you should see if you can do it a different way. Good estimators frequently get the same thing a couple of ways so they can find an even better estimate.
(practice!)
Cool. How did that go? What I did here is something like this:
I “know” that the US is about 3000 miles wide. (maybe because I did the previous warmup!)
I know that the US spans 3 time zones, since when I call my mom on the East coast she is 3 hours ahead.
This means each “time zone” is probably about 1000 miles.
I’m guessing there are 24 time zones, so the circumference is probably like 24000 miles.
We know that the circumference is \(2\pi r\), and \(\pi\) is close to 3, so the answer is 24000/6 = 4000 miles.
I like this approach (there are others!) because it uses things we feel from real life. For example, if you didn’t know (1), maybe you could have gotten it with your own experiences. Maybe you did a cross-country drive before and you know it takes about 5 days to drive cross-country doing like 12 hours of driving a day at like 80mp/h. This means you’re driving 960 miles a day and the width of the US should be about 5000 miles. This is a bit high but still the right order of magnitude. You probably slept a lot on day 4, or spent too long going through Manhattan in a way unrepresentative of the rest of the trip.
Okay, let’s try another one. How many McDonalds are there in the US?
(practice!)
This was my approach. Again, this isn’t meant to be the “right” approach - I would be very interested to hear what things you did!
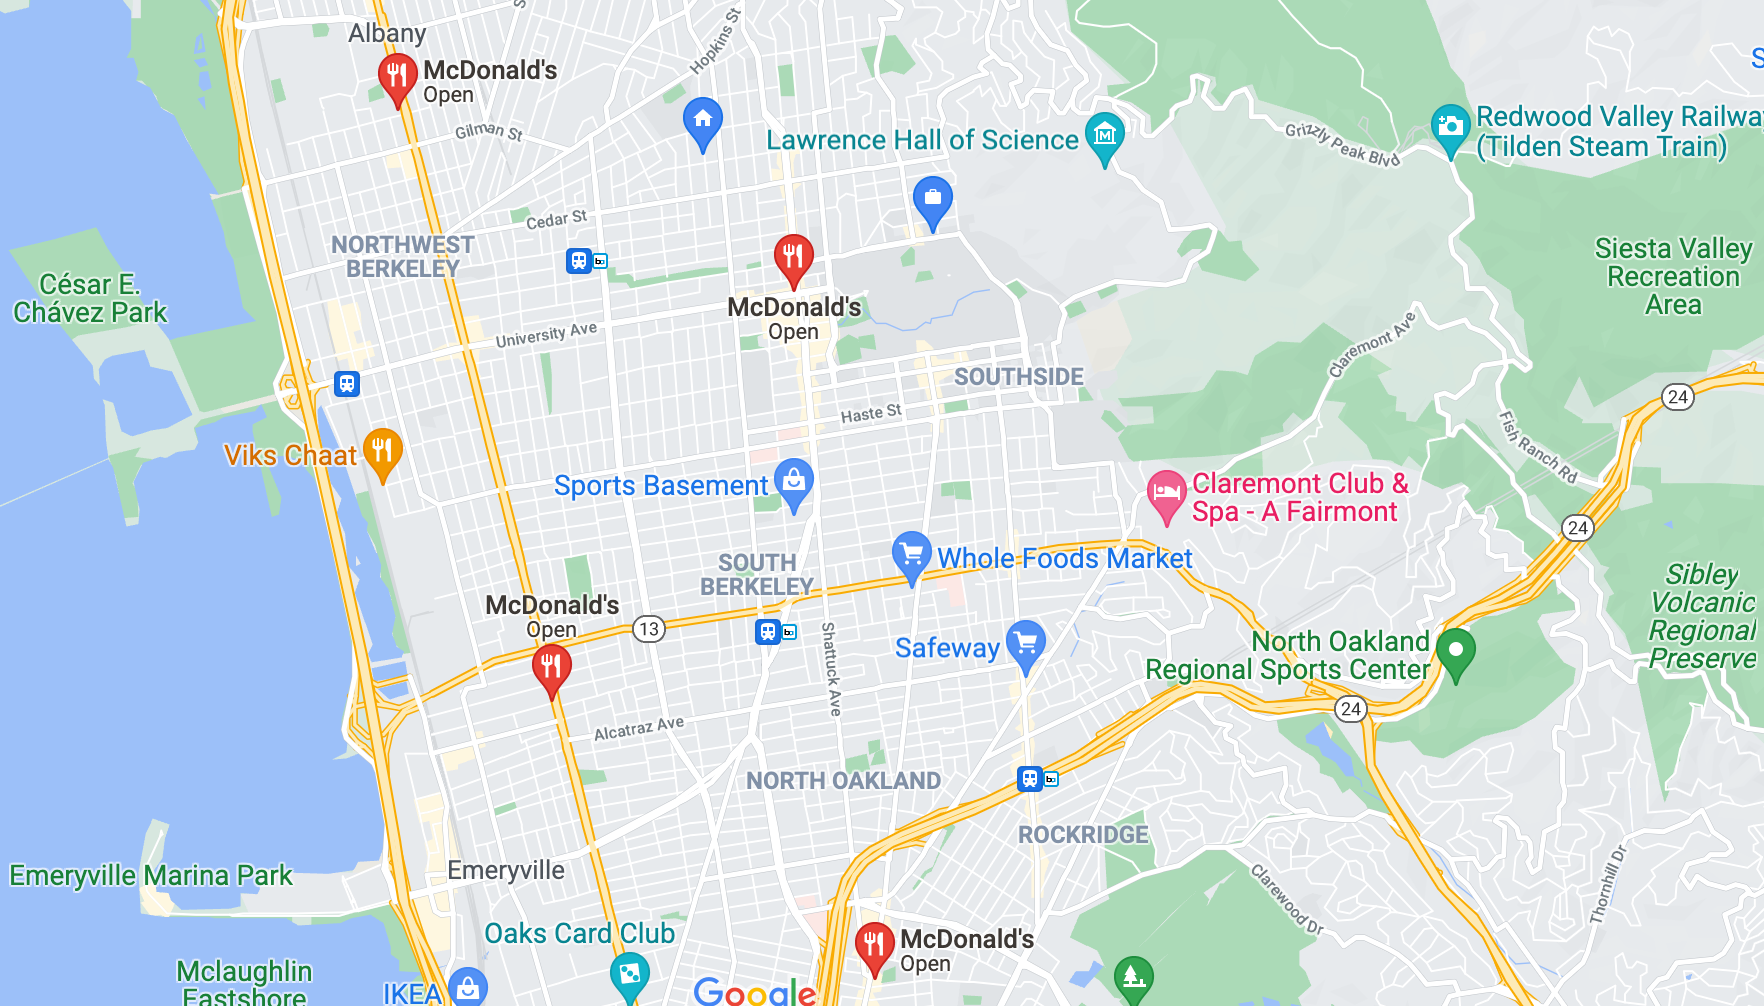
I feel there are probably 4 McDonalds in the Berkeley area, from having lived there a few years.
Sure some cities are bigger and most are smaller, but closing my eyes, I feel there are probably around 1000 “Berkeleys” in California by “overall coverage of McDonalds.” So there are probably 4000 McDonalds in California.
There are 50 states and California is pretty big, so I’ll multiply by 10 and get something like 40,000 McDonalds in the US.
I look it up. The answer is 14,000, so I did pretty well (by order of magnitude), but I got it a bit high. So is there something I can improve here?
One place with room for improvement is where I counted California as “about 1000 Berkeleys”. Let’s dig into other possible ways to make this estimate:
- By Google (or if we had more time, another estimation!), it looks like Berkeley has 120,000 people and California has 40 million people, so by population there are more like 400 Berkeleys in California.
- By geographical area, Berkeley’s area seems to be 20 mi^2, and California’s area is 163696 mi^2, so you can fit about 8000 Berkeleys in California by size. Lots of California is not as densely populated as Berkeley (e.g. farmland), so maybe there are 8000/10 = 800 “Berkeleys” in California.1
- Since what we want is somewhere in the middle, it still looks like our original estimate of 1000 “Berkeleys” is on the “high end” of what’s reasonable, so it makes sense that the number of McDonalds was a bit lower than our original estimate.
There are plenty of other places to improve as well! (for example, maybe my intuition of the ratio of California and the US is the weaker one here)

Google maps highlighting McDonalds around Berkeley
And now I learned something about McDonalds, Berkeley, and California!
4.5 Summary
When in doubt, Google, but estimation is kind of like the weight room for forecasting and reasoning about the world.
It is also very helpful for physicists and surprisingly helpful for things like tech / business interviews, where people use it as a way to test your grasp of the world, so there’s some pragmatic reason to get good at them
It turns out that we have a lot of nice intuitions about the world, and estimation allows us to articulate them and get pretty good numbers!
(Thanks to Frances Ding and Jacob Steinhardt for help preparing this post. Much of this material is based on something I run at SPARC, so thanks to the many people over the years who have contributed to that as well)
Note you can also do something like estimate that the US is 6,000,000 mi^2 by estimating it as a rectangle with our earlier “result”, and jump straight to “we can fit 300,000 Berkeleys in the US by geographic area,” which you can then downgrade a bit since Berkeley has a higher population density than the average plot of land, to get a more reasonable answer. So the more estimations you do, the better you will be at doing other ones!↩︎